Peter's Solaris Zone
JKstat
31 May 2026: version 1.10. Download
| JKstat on GitHub
JKstat provides a jni interface for Java applications to access
Solaris and illumos kstats.
In addition to the jni library and supporting classes, JKstat also
provides a graphical browser to explore the kstat hierarchy, and a small
number of standalone utilities such as jcpustate.
To use the kar support, both the browser and
the chartbuilder support a -z flag to tell it which zipfile to
open. For example:
./jkstat browser -z /var/adm/ka/ka-2010-03-01.zip
or
./jkstat chartbuilder -z /var/adm/ka/ka-2010-03-01.zip
JKstat can run in client-server mode, so you don't need to run the
GUI on the monitored host:
./jkstat server -p server_port
where the argument to the -p flag specifies which port you would like
the server to listen on. Then on the client machine, run the browser
like so:
./jkstat remotebrowser -s http://server_name:server_port/
If you're on windows, then download,
unpack the zip file, and double-click on the
jkstat.bat file to start the client.
To see what subcommands are available, just run jkstat without any
arguments.
The Kstat browser:
The fsstat utility:
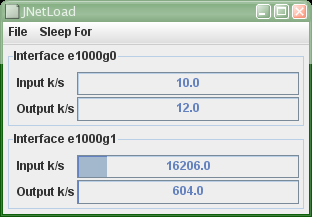
The network traffic gadget:
A java version of xcpustate:
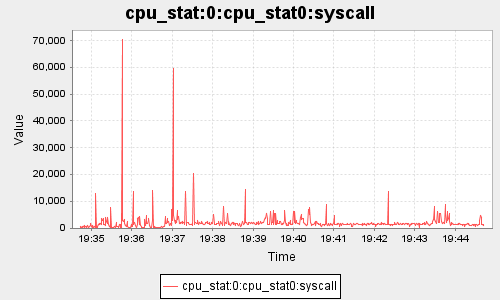
A sample chart:
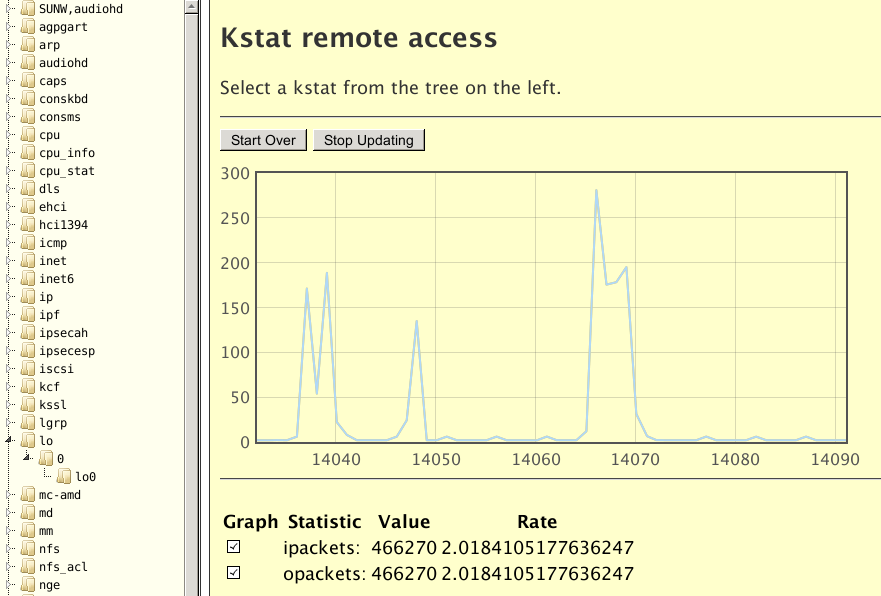
The javascript browser interface:
JKstat is specific to Solaris and illumos, and I'm developing on
Tribblix, but it ought to work on Solaris. You will require Java 11
or later, though. If you're stuck on J2SE 5, then download version
1.0.
Version History
- 1.10
- Lots of code and dependency modernization.
- 1.1.1
- Tweak wrapper and build scripts for newer distros, java versions,
jersey, and flot (no code changes from 1.1).
- 1.1
- Update JFreeChart, better desktop integration, requires Java 6.
- 1.0
- Stable release.
- 0.70
- Jersey support for a RESTful server, and a javascript client.
- 0.69
- Refactor mpstat, adding right-click menu for charts.
- 0.68
- Update httpclient, allow kar to turn off the parser cache.
- 0.67
- Custom charts of IO kstats.
- 0.66
- Applet version. RESTful war build. Remove some unused code. Tidy up
accessories. Abstract away rate calculations.
- 0.65
- A handful of minor fixes.
- 0.64
- Play framework example;
tidy up client-server invocations.
- 0.63
- Update to latest Jfreechart.
- 0.62
- Spit and polish.
- 0.61
- Minor tweaks, including to graphs and JSON parsing code for a kar
update.
- 0.60
- Incompatible changes to the way chain updates are handled, so
consumers must always explicitly check the current chain id against
theirs rather than asking if it's changed.
- 0.53
- Remove interesting subcommand. Fix connection leak in the RESTful
client.
- 0.52
- Add RESTful support to the chart builder. Remove kstat -p support.
- 0.51
- RESTful client (as provide by node-kstat). Remove JavaFX demos.
- 0.50
- Remove the old private kar format support.
- 0.45
- Add JSON support for kar and the client-server mode.
- 0.44
- More code and javadoc cleanups. Moved some demos back from
solview; removed some of the cruftier demos. General polish. Charts
display statistics in the requested order. KstatFilter negative
matching bug. Preliminary attempt at sparklines and an 'interesting'
subcommand.
- 0.43
- Many code and javadoc cleanups. The netload demo now resizes
properly, and the network accessory calculates the speed correctly. The
browser gets reset and backwards for kar output.
- 0.42
- Added JMX and groovy examples. Improvements to Sequenced kstats to
allow caching, and other changes to allow significant performance
improvements in kar.
- 0.41
- Cleanups, strip chart demos, and removal of Kstat.getMap() in
favour of ks.statistics().
- 0.40
- Cleanups, and Kstat implements Comparable making sorting much
easier.
- 0.39
- Cleanups, bugfixes, can build svr4 packages.
- 0.38
- Parse new kar output format.
- 0.37
- 64-bit version, and png and areapng subcommands for cli chart
generation.
- 0.36
- Spring clean, just a bunch of tidying up.
- 0.35
- SequencedJKstat support for kstat -p output.
- 0.34
- KstatAccessorySet to drive multiple accessories together.
- 0.33
- Preliminary kstat -p parser support.
- 0.32
- Code cleanups, better exception handling.
- 0.31
- Code cleanups, should be no user-visible changes.
- 0.30
- Interactive chart builder. Code and javadoc cleanup. kstat cli
emulation now essentially complete.
- 0.29
- Code and javadoc cleanup; JavaFX example.
- 0.28
- Charts enhanced.
- 0.27
- Improved client-server mode.
- 0.26
- Experimental client-server mode added.
- 0.25
- Major refactoring and simplification.
- 0.24
- Added arcstat demo (removed in 0.25 and moved to SolView).
- 0.23
- Code cleanup using PMD.
- 0.22
- Added KstatAggregate class. Added ProcessorTree to map the cpu
structure. The psrinfo subcommand tests that. The cpustate demo shows
aggregate core and chip statistic for multithreaded amd multicore
machines. (The advanced cpustate demo was moved to SolView in version
0.25.) The cpustate and netload demos gain charts.
- 0.21
- Fixes NPEs when given a kstat with missing data. Humanizes the
units in the network rate display, and removes the kstatbrowser wrapper
(use "jkstat browser" instead).
- 0.20
- Text in resources. Updated jfreechart. kstat charts can have other
statistics added. Regular expression support in KstatFilter.
- 0.19
- Handle kstat chain updates. A master jkstat utility with the other
utilities implemented as subcommands. Removed unused native
methods. Added CDDL license text. Restructured the directory
layout. The browser Trees have models.
- 0.18
- Refactoring continues: common code eliminated from demos. Added
jkmemalloc utility; added jkchart utility.
- 0.17
- More code cleanups. Added chart displays using JFreeChart.
- 0.16
- More code cleanups. And more sensible class names. Overall, the API
is getting closer to where I want it to be.
- Browser sorting works properly.
- 0.15
- Many code cleanups: jstyle, generics, collections.
- First attempt at jmpstat. Other sample applications use filters.
- Browser now sorts. Thanks Tom!
- 0.14
- Add KstatFilter.
- jnetio has gone; jnetload is the new gadget.
- Menus cleaned up - RadioButtons for all the sleep menus, mnemonics
used consistently.
- 0.13
- Use SpringLayout in place of GridLayout.
- Add mm:0:phys_installed.
- Fix a number of display corruption issues.
- Right click popup menus in jiostat and jcpustate.
- 0.11
- The kstatbrowser now uses a JTable, rather than mocking up the
table in html.
- Added a new jfsstat utility to display the new kstats introduced
alongside the fsstat utility in Nevada build 35. The JTable also uses
the TableSorter class from the Java Swing tutorial to allow you to sort
the data.
- 0.10
- More work on jiostat, fixing up underlying performance
problems.
- 0.09
- This introduced jiostat, but was never released due to the
performance problems that jiostat encountered. Hopefully 0.10 is much
better.
- 0.08
- The accessories have been significantly cleaned up and are better
structured. Rates now use the snaptimes, and accessories for the
distribution of packet sizes on bge interfaces and dma transfer rates
on ifb graphics cards have been added.
- 0.07
- Some more raw kstats, and some more graphical helpers. A general
code cleanup and restructure. Ability to clone the kstatbrowser window,
and help and license details. Added jcpustate, just like xcpustate.
- 0.05
- Add graphics to the kstat browser, so you get a continually
updating graphical representation of I/O and network traffic.
- 0.04
- Add some statistics, so you can see a breakdown of how many kstats
are in a given module, class, or type. Add the capability to update the
currently viewed kstat. Add the first raw kstat - nfs mntinfo.
- 0.03
- Add support for I/O and interrupt kstats. It should be easy to do
timer kstats, but I haven't found any yet to test with. And raw kstats
aren't hard - they just need to be done individually, which will take
time. I also added browsing by kstat class and type.
- 0.02
- Graphical kstat browser added. Run kstatbrowser.
- 0.01
- Simplifies the code, while adding graphical tools to display load
average and network utilization.
- 0.00
- Initial release. Classes to return the type of a kstat and its
value.
Peter's Home | Zone Home