The About tab gives you details of the relevant MIB entry. Siblings are different instances of the same thing; cousins are different properties of the same instance.
31 May 2026: version 0.20. Download | Jangle on GitHub
Jangle provides a simple graphical snmp browser.
It is based on (as in a simple cut-and-paste job) some code from JKstat and leverages Jonathan Sevy's Java SNMP Package for basic SNMP support and Mibble for MIB parsing, and JFreeChart for the graphical charts.
(Note: I'm using Mibble 2.3, which has the GPL Library Exception, to avoid licensing headaches.)
The idea was to produce graphical charts just like I can in JKstat. I had a look around for existing utilities to do this, but none seemed complete.
Hence what I've produced so far. It started out as a simple exploratory tool: what's possible in this space? It's evolved into something that can actually be useful.
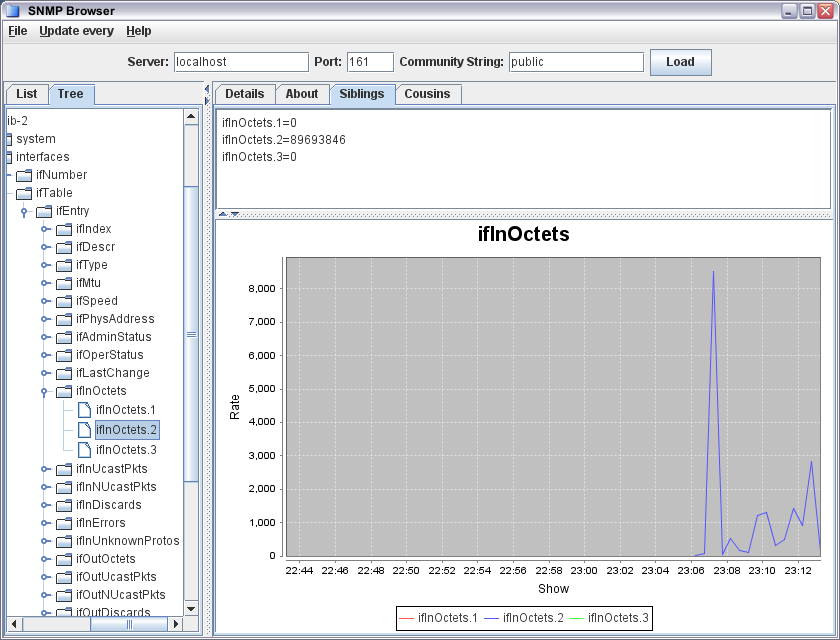
Just a simple screenshot:
The About tab gives you details of the relevant MIB entry. Siblings are
different instances of the same thing; cousins are different properties
of the same instance.